
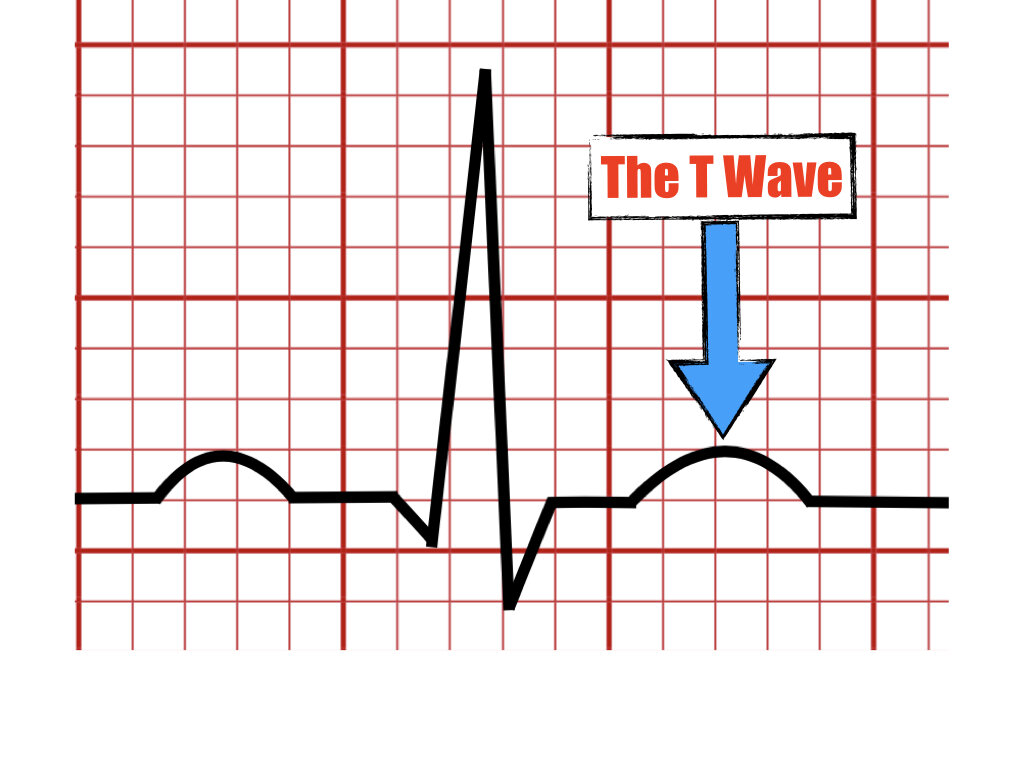
The T Wave

In this article, we discuss the meaning of the T wave in the ECG and its normal parameters including amplitude, morphology, and axis. Additionally will mention causes that can lead to abnormalities of these parameters.
Introduction
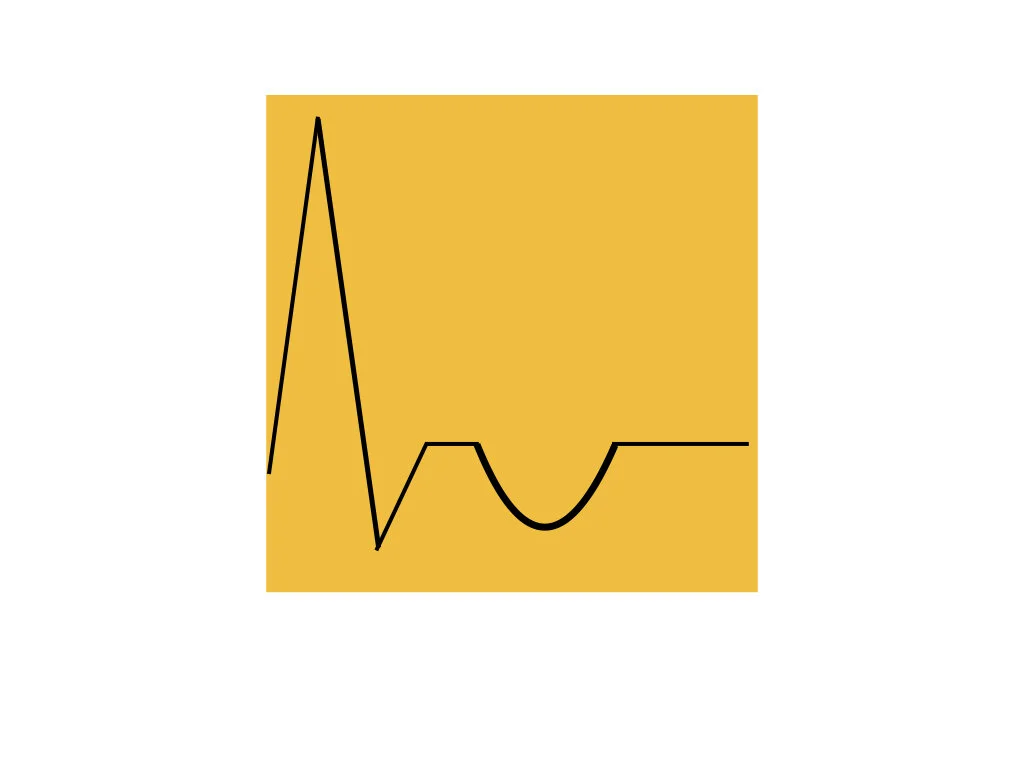
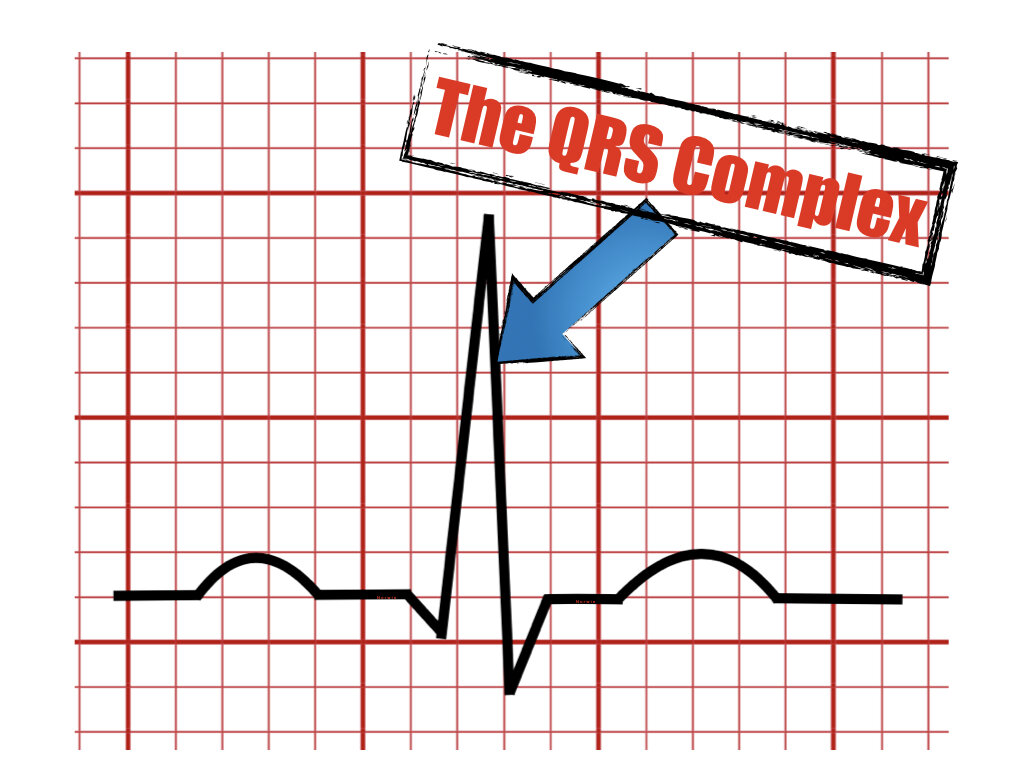
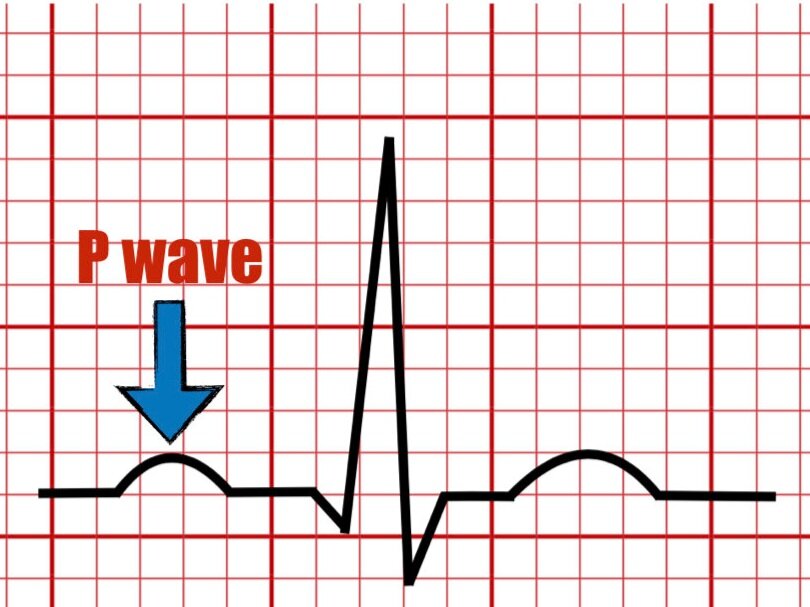
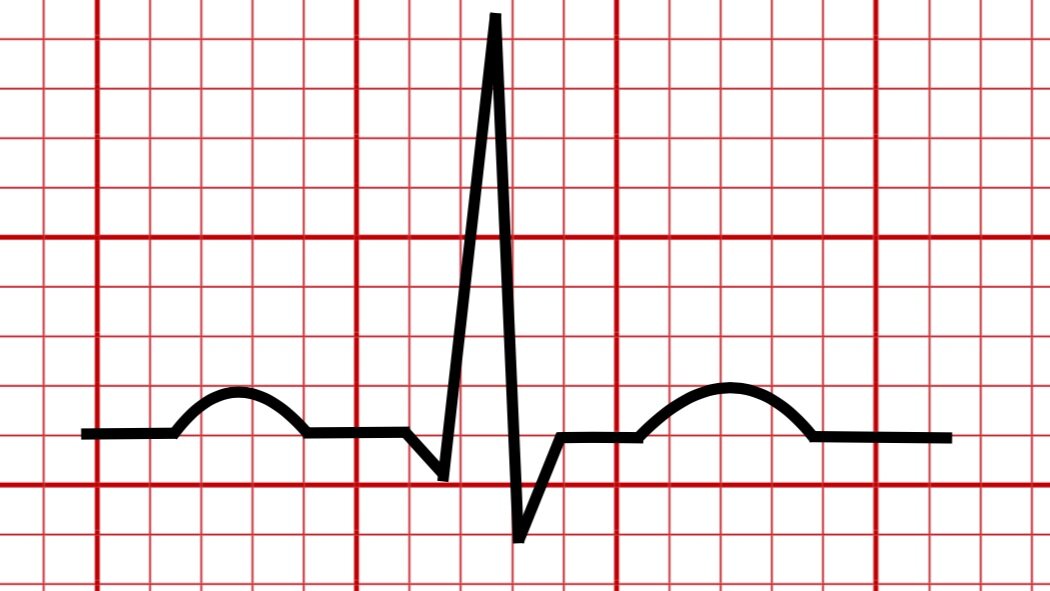
The T wave
Represents the final phase of ventricular repolarization.
Is the result of the restored negative electrical charges inside the ventricular cells.
Is seen as the first positive wave following the QRS complex.
The T Wave Amplitude
Limb leads - Normally less than 0.5 mV (5 mm). The tallest T wave in the limb leads can be seen in lead II.
Precordial leads - Less than 1.0mV (10 mm) and usually 0.6mV (6mm) on average. The tallest T wave in the precordial leads is seen in v2 - v3 and may reach 1.0mV (10 mm) or more.
The T wave Morphology
Quantitative descriptors
Low: amplitude less than 10% of R wave.
Flat: peak T wave amplitude between 0.1mV (1 mm) and -0.1 mV (1 mm) in leads I, II, aVL, v4-v6.
Inverted : T wave amplitude -0.1mV (-1mm) to -0.5 mV (-5 mm).
Deep negative : T wave amplitude -0.5 mV (-5mm) to -1.0 mV (-10 mm).
Giant negative: more negative than -1.0 mV (-10mm), seen in HOCM, NSTEMI, intracerebral hemorrhage).
Qualitative descriptors

Peaked T wave

Symmetrical T wave
Inverted T wave

Biphasic T Wave


The T Wave Axis
The normal T wave vector is directed leftward, inferiorly, and anteriorly.


Key Takeaway
The T wave denotes repolarization of the ventricle with restored negative charges inside the cells.
The T wave size should be less than 10 mv (10mm) in precordial leads and less than 5 mv (5mm) in the limb leads.
The T wave has different morphologies including symmetrical, peaked, biphasic, or inverted.
Several causes can lead to a change in the normal morphology of the T wave.
The T wave is upright in leads I, II, v3-v6, always inverted in lead aVR and upright or inverted in leads v1, v2, aVL, III, and aVF.
References
Rautaharju PM, Surawicz B, Gettes LS. AHA/ACCF/HRS Recommendations for the Standardization and Interpretation of the Electrocardiogram part IV. J Am Coll Cardiol. 2009;53:982-991.
Surawicz, B., Knilans, T. K., & Chou, T.-C. (2008). Chou's electrocardiography in clinical practice: Adult and pediatric. Philadelphia, PA: Saunders/Elsevier.
Zipes D, Libby P, Bonow R et.al, Braunwald’s Heart Disease: A Textbook of Cardiovascular Medicine 11th edition, 2018.
Somers MP, Brady WJ, Perron AD, Mattu A. The prominent T wave: electrocardiographic differential diagnosis. Am J Emerg Med. 2002 May;20(3):243-51.
O’Keefe J, Hammill S, Freed M, The Complete Guide of ECGs 4th edition, 2016.
Please send your feedback!
In this blog, we are going to explain the meaning of the U wave in the electrocardiogram and provide examples of normal and pathologic causes of its appearance on the ECG.