
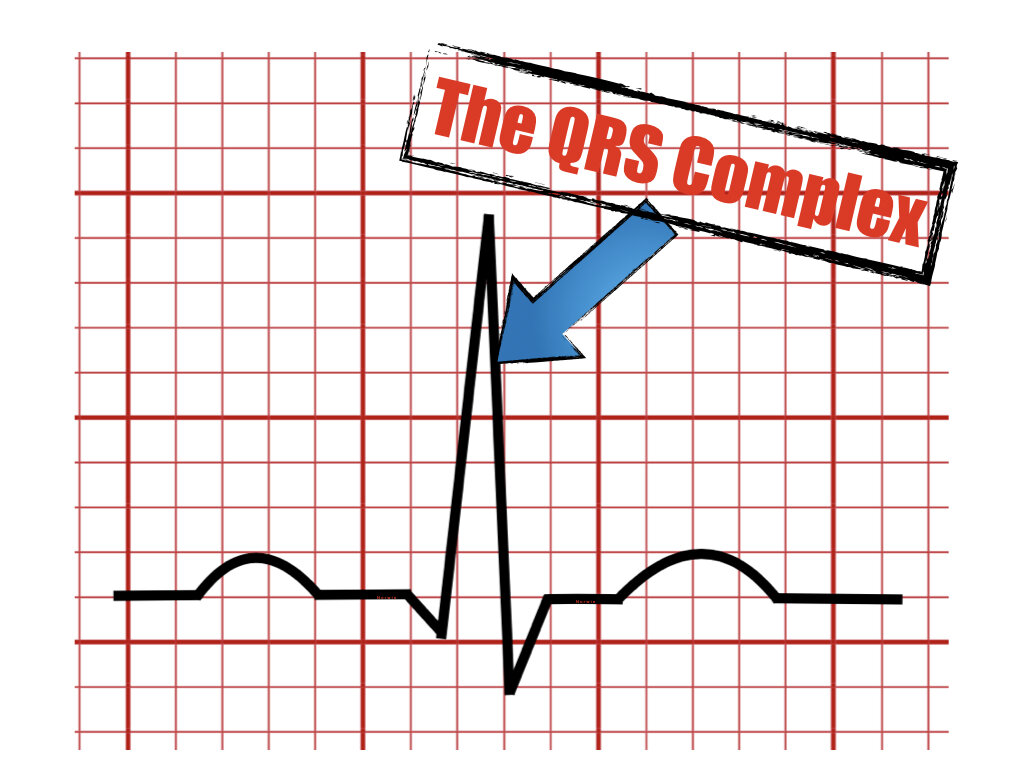
The QRS Complex

This article will explain the meaning of the QRS complex and its normal parameters of axis, duration, and amplitude. Additionally will mention some pathological conditions where these parameters could be altered.
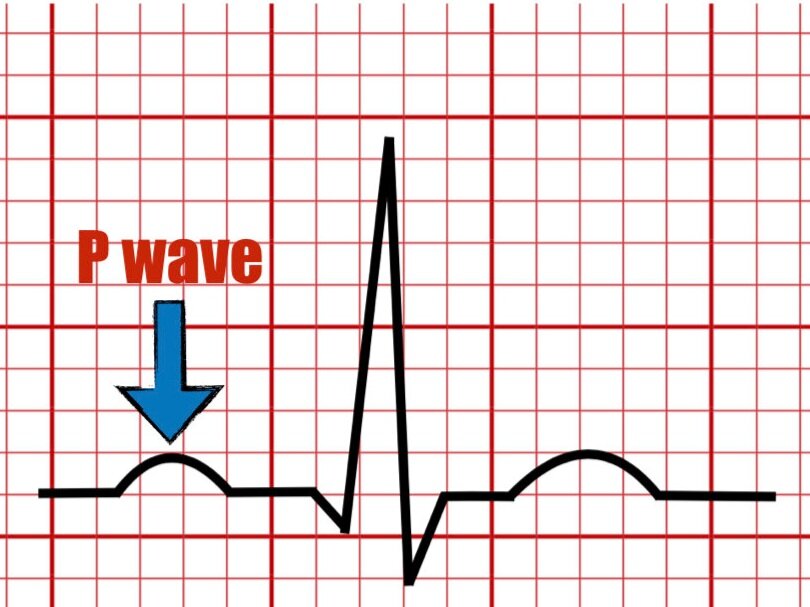
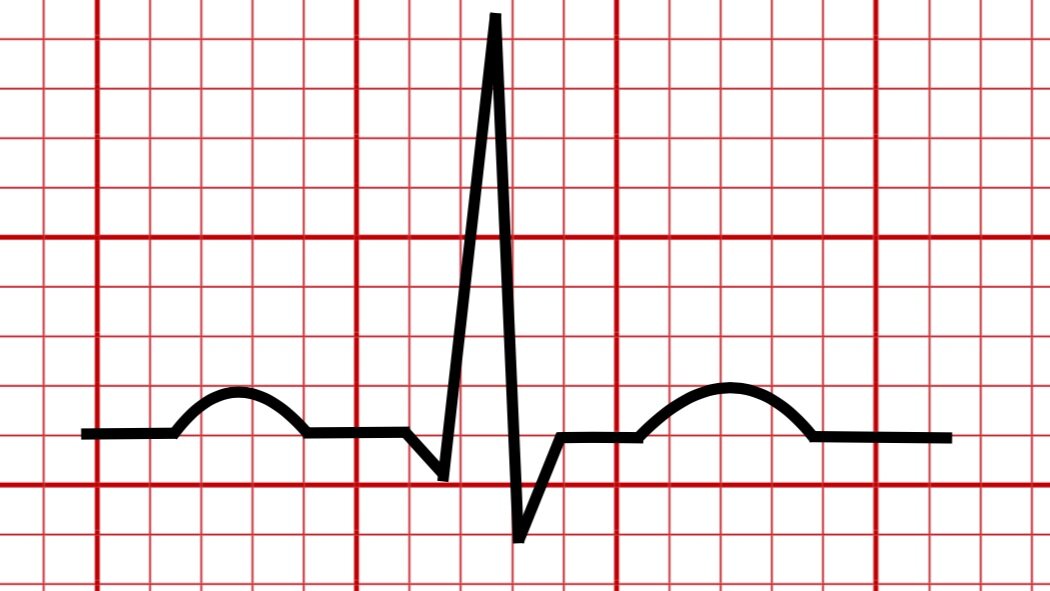
The QRS represents the start of ventricular activation leading to contraction of the ventricles. Depolarization wave travels along the His-Purkinje fibers and gives the characteristic QRS complex.

The first downward deflection is called the Q wave, the second upward deflection is called the R wave and the second downward deflection is called the S wave.
Any additional positive wave after the R wave will be referred to as the r’ or R’. The bigger deflection will be assigned an upper case letter and the smaller would be attributed a lower case. If both are the same size then an upper case would be attributed to both (refer to the rSR’ and RSR examples).
Several other QRS complex configurations exist but, we refer to ventricular depolarization as the QRS complex for simplicity.
Additional configurations may include but are not limited to :
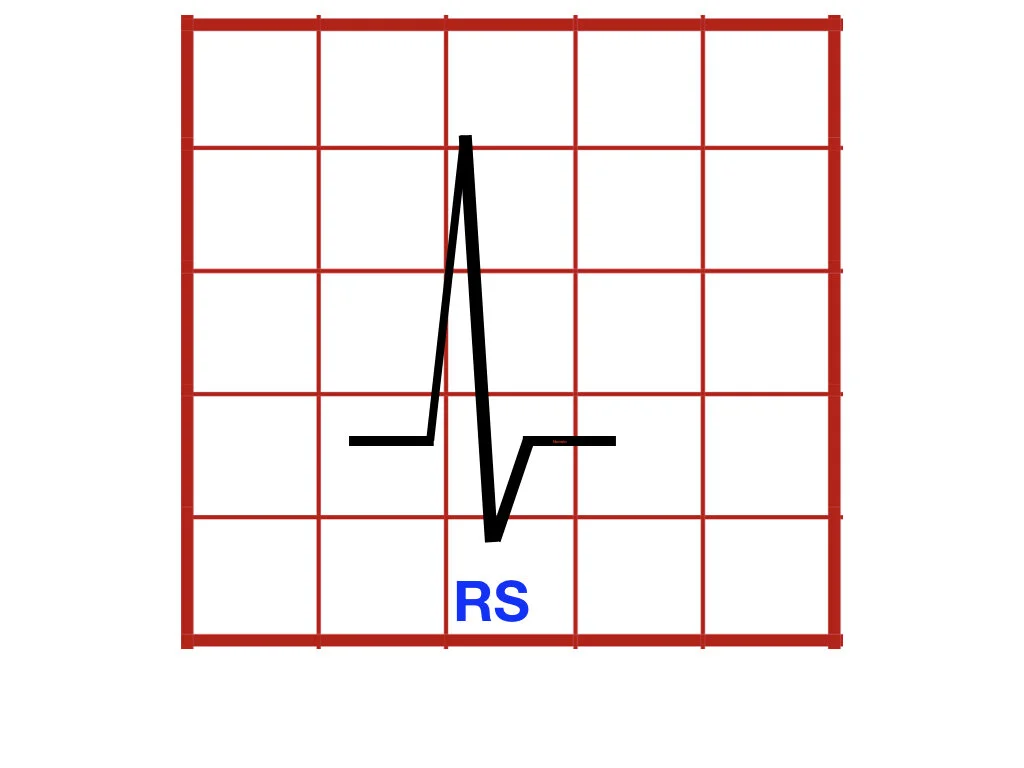
RS Configuration

R Configuration

rSR’ Configuration

RSR’ Configuration

QS Configuration
QRS duration
The normal QRS duration is between 0.07 and 0.10 seconds (less than 2.5 small boxes).

Moderate prolongation of the QRS complex is considered between 0.10 seconds and 0.120 seconds.
Marked prolongation of the QRS complex is > 0.12 seconds.
Causes for prolongation of the QRS complex include :
Left Bundle Branch Block
Right Bundle Branch Block
Ventricular Preexcitation
Electrolyte disturbances
Intraventricular conduction delay
QRS Amplitude
The normal amplitude (voltage) of the QRS complex may vary by age, gender, and race.
Increased in the amplitude of the QRS can be seen in :
Left/Right Ventricular Hypertrophy
Left bundle branch block
Preexcitation
Pacing rhythm
Decreased amplitude (low voltage) of the QRS may be present in :
Pericardial effusion
Pleural effusion
Myxedema
Diffuse CAD
Infiltrative cardiomyopathies
Pneumothorax
COPD or pulmonary disease
Normal variants
QRS Axis
The QRS axis portrays the direction of the mean QRS vector during ventricular activation. The normal axis of the QRS complex is -30˚ - + 90˚.
Left axis deviation
-30 and -45 (moderate deviation)
-45 and -90 (marked deviation)
Right axis deviation
+ 90 - +120 (moderate deviation)
+120 - +180 (marked deviation)


(+) implies NET positive QRS voltage
(-) implies NET negative QRS voltage
Axis deviation can occur in :
After Myorcardial Infarction
Left or Right Ventricular Hypertrophy
Left Anterior Fascicular Block
Left Posterior Fascicular Block
Left Bundle Branch Block
Key Takeaway
The QRS complex represents the start of ventricular activation leading to contraction of the ventricles.
It is composed of the first negative deflection called Q wave, followed by a first positive deflection R wave, and a second negative deflection called the S wave.
Several other configurations for the QRS complex exist but we refer to ventricular depolarization as the QRS complex for simplicity.
The normal duration of the QRS is < 0.10 seconds.
The QRS complex amplitude will normally vary by age, race, and ethnicity.
The normal axis of the QRS complex is -30˚ - + 90˚.
Several pathologic states may alter the QRS complex duration, amplitude, and axis.
References
Surawicz B, Childers R, Deal BJ, Gettes LS, et al. AHA/ACCF/HRS Recommendations for the Standardization and Interpretation of the Electrocardiogram part III. J Am Coll Cardiol. 2009;53:976-981.
Surawicz, B., Knilans, T. K., & Chou, T.-C. (2008). Chou's electrocardiography in clinical practice: Adult and pediatric. Philadelphia, PA: Saunders/Elsevier.
Zipes D, Libby P, Bonow R et.al, Braunwald’s Heart Disease: A Textbook of Cardiovascular Medicine 11th edition, 2018
O’Keefe J, Hammill S, Freed M, The Complete Guide of ECGs 4th edition, 2016.
Please send your feedback!
In this blog, we are going to explain the meaning of the U wave in the electrocardiogram and provide examples of normal and pathologic causes of its appearance on the ECG.