
ECG 101: The ECG Paper Explained

In this blog, we are going to discuss the ECG paper, including the axes components and calibration. Understanding this basic concept will facilitate ECG interpretation.
Introduction
The ECG paper consists of a grid where all cardiac events are recorded. Some of the tasks that can be performed using the ECG grid may include, but are not limited to :
Heart rate calculation
Assessing the size of a cardiac chamber
Determining the presence of a conduction block or a pause duration
Evaluation of ischemia or myocardial infarction
Arrhythmia detection
Axes of the ECG paper

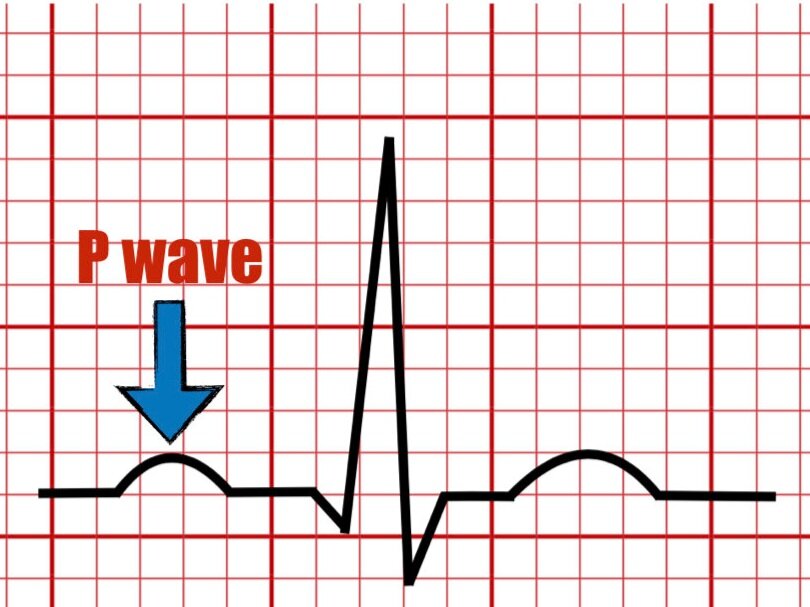
The ECG grid has a horizontal and vertical axis.
The vertical axis measures the amplitude of a wave in millivolt (mV).
The horizontal axis measures time in seconds (s).
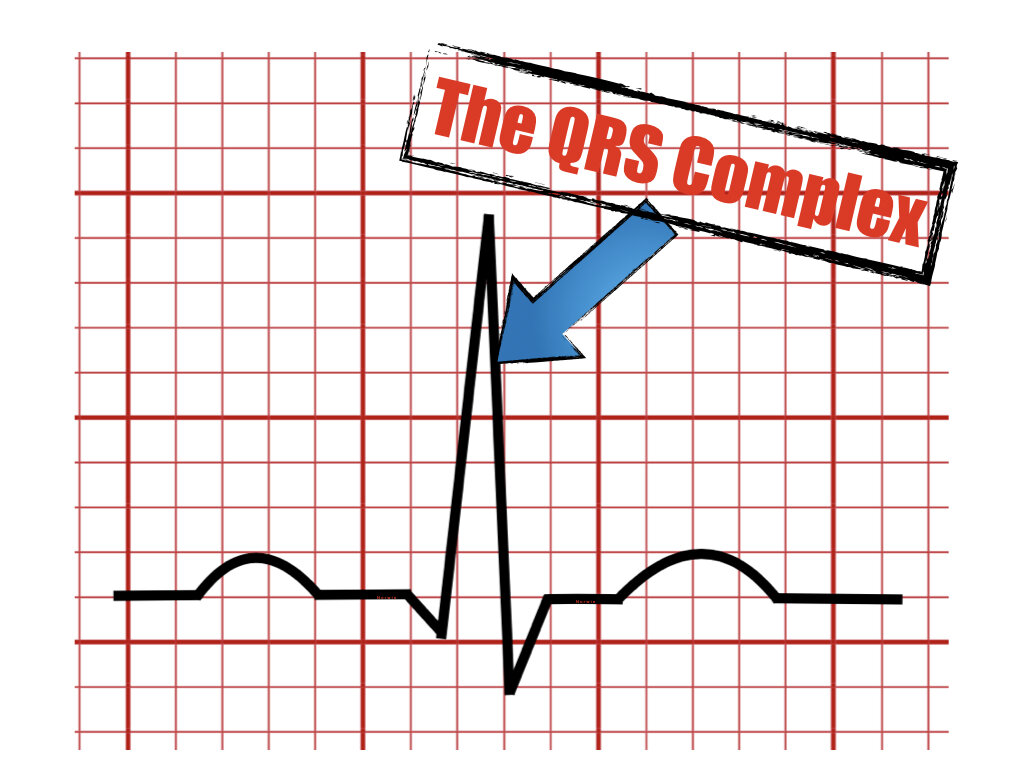
Vertical Axis (Amplitude)

The vertical height of every small box equals 0.1 mV (1 mm).
The height of a wave represents the voltage that emits.
Higher voltages suggest a larger muscle mass and possible chamber enlargement.
Lower QRS complex voltages may have several pathological causes.
Clinical Correlation

The ECG demonstrates an R wave that measures more than 11 mm in lead aVL suggesting enlargement of the left ventricle.

This ECG demonstrates a QRS amplitude less than 5 mm in all the limb leads consistent with low voltages.
Lower voltages can be seen in several pathological states such as pericardial effusion, pleural effusion, COPD, diffuse coronary artery disease, etc.
Horizontal Axis (Time)
The horizontal axis represents time measured in seconds.
Every small box represents 0.04 seconds or 40 milliseconds(ms).

One big box (red bold corners) contains 5 small boxes, 0.04 seconds each.
It has a duration of 0.2 seconds (200 ms).
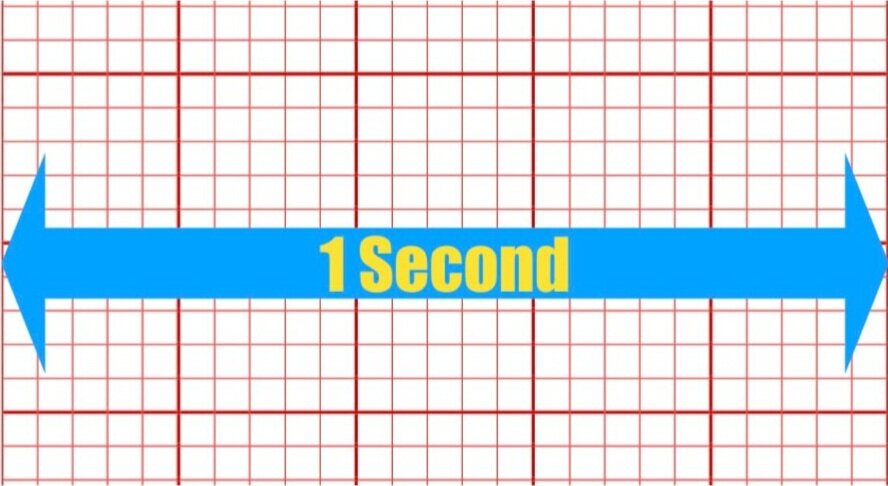
Five big boxes (25 mm) have a duration of one second.
The typical paper speed is 25 mm per second.
Clinical Correlation


The top ECG demonstrates a normal sinus rhythm at a heart rate of 60 bpm. Notice the appearance of a QRS complex every second (5 boxes).
The ECG at the bottom shows a more frequent QRS complex which translates to a faster heart rate when compared to the top ECG.
Calibration

The first step when examining an ECG is to assess for normal calibration.
It is very important to make sure the ECG paper is standardized to 1 mv (10 mm) vertically and 5 mm (0.2 seconds) horizontally as shown in the image above.
Improper calibration may miss the proper chamber size.
Keypoints
The ECG grid record all cardiac events in the vertical and horizontal axes.
The horizontal axis represents time, measured in seconds (s).
The vertical axis represents voltage, measured in millivolt (mV).
The first step when reading an ECG is to look for proper calibration.
The ECG should be standardized to 10 mm vertically (1 mV) and 5 mm horizontally (0.04 seconds).
Failure to have calibration of the ECG may miss proper chamber size.
Please send your feedback!
In this blog, we are going to explain the meaning of the U wave in the electrocardiogram and provide examples of normal and pathologic causes of its appearance on the ECG.